
Exploring the Impediments to the Youth Financial Inclusion in Botswana
Wilbert Kudakwashe Chidaushe*  , Stegi Shine and Mini Sebastian
1Department of Accounting and Finance, Botho University, Gaborone, Botswana, Botho University Kgale View Education Park, Botswana .
wilbert.chidaushe@bothouniversity.ac.bw
http://dx.doi.org/10.12944/JBSFM.06.02.04
The research explored the various Batswana youth characteristics that hinder Botswana youths from obtaining finance to start up business ventures. The objective of the project was to investigate the entrepreneurial, socio-cultural factors and other variables that impede various Botswana youth from accessing funds in Botswana. The significance of the study was to examine the impediments to youth financial inclusion in Botswana. The research methodology for the study was based on the quantitative research method involving descriptive research. The study administered 800 survey questionnaires to university students. Statistical Package for Social Science was used to analyse the data. The key findings of the study were that limited knowledge on youth needs, tight business licensing and business registration procedures are a significant hindrance to accessing youth funds in the country. There was no correlation between the impediments to youth financial access with enablers of youth financial access, enablers of youth entrepreneurial skills and socio-cultural factors. Policy makers should loosen procedures for youth business registration to facilitate the âease of doingâ business by the youths in the country paying special attention to rural youths. Policy makers should promote unbiased public to private initiatives of raising youth awareness of the requirements to access youth entrepreneurship funds in the country.
Copy the following to cite this article:
Chidaushe W. K, Shine S, Sebastian M. "Exploring the Impediments to the Youth Financial Inclusion in Botswana". Journal of Business Strategy Finance and Management, 6(2).
DOI:http://dx.doi.org/10.12944/JBSFM.06.02.04Copy the following to cite this URL:
Chidaushe W. K, Shine S, Sebastian M. "Exploring the Impediments to the Youth Financial Inclusion in Botswana". Journal of Business Strategy Finance and Management, 6(2). Available here: https://bit.ly/4hAh3nF
Download article (pdf) Citation Manager Publish History


Introduction
The Consultative Group to Assist the Poor (CGAP) focusing mainly on financial access agenda defined financial inclusion as a position through which businesses and households have access and can effectively use the appropriate financial services. Further it is re-iterated that such services should be provided sustainably and responsibly in well regulated environment.
In addition according to another study formal financial services were defined as those that are subject to the financial sector regulations of the countries in which they are offered and whilst informal financial services were defined as a wide range of financial activities and services that take place outside the scope of the countryâs formalized financial institutions and are not under the supervision of the central bank and any other regulatory authorities (Sykes et al., 2016).
In addition, the Organisation for Economic Cooperation and Development [OEDC, 2020] defined youth as those that fall within the age bracket of 14 to 24 years old.The following were discovered as common barriers to financial inclusion (Boateng, 2015),
Financial misunderstanding and lack of information between consumers and providers.
Age discrimination and gender. Studies in the past revealed that young people and women are more likely to be financial excluded than others.
Unpredictable cash flows and low-income individuals.
Unsuitable goods and procedures from service providers that aren't adapted to the requirements of the underprivileged.
High opportunity costs and transportation costs for people to bank with formal financial institutions, as well as high transaction costs for banks operating in remote places.
measures at the national and international levels that prevent the world's poorest people from being financially included.
Financial inclusion metrics at the national level are compiled and summed up for everyone by important demographic traits in the Global Financial Inclusion Index (Findex). The main financial barrier facing young people in Botswana (ages 15 to 24) is a lack of finances (61%). Compared to South Africa (10%) and the United States (0%), Botswana has a much larger barrier to youth access financing (61%), as indicated in table 1 below, than any of the other countries. When compared to all other nations, Zimbabwe has the largest barrier to youth finance at 79%.
Furthermore, compared to the United States (8%), South Africa (4%), and Botswana (1%), the country's availability to capital through company and housing loans is incredibly low. Therefore, the goal of this study is to investigate the barriers that young people in Botswana face while trying to obtain funding for their business ventures.
Table 1
KFII | 1 | 2 | 3 | 4 | 5 | 6 | 7 | 8 | 9 | 10 | 11 | 12 | 13 | 14 |
BWP | 48 | 35 | 15 | 19 | 17 | 18 | 61 | 10 | 1 | 19 | 9 | 6 | 1 | 1 |
ZAF | 69 | 61 | 12 | 16 | 22 | 27 | 10 | 57 | 1 | 38 | 11 | 14 | 4 | 4 |
ZWE | 48 | 20 | 14 | 49 | 19 | 5 | 79 | 10 | 1 | 25 | 22 | 2 | 2 | 2 |
USA | 93 | 87 | 0 | 0 | 0 | 0 | 0 | 0 | 0 | 0 | 59 | 30 | 8 | 8 |
Source: World Bank Global Financial Inclusion Index 2017
Index for key financial inclusion indicators (KFIIs)
1. Having Account rural (% age 15+)
2. Young adults with financial institution accounts (ages 15 to 24)
3. The percentage of people aged 15 and older without a financial institution account is too high.
4. No account due to incomplete documentation (percentage of people aged 15 and up)
5. No account due to a lack of faith in the financial institution (percentage of people aged 15 and up)
6. No account due to religious beliefs (percentage of people aged 15 and up)
7. No account due to a lack of finances (percentage of people aged 15+)
8. No account since another family member has one (percentage of people aged 15 and up)
9. No account since no financial services are required (percentage of people aged 15 and up)
10. No account due to the high cost of financial services (percentage of people aged 15 and up)
11. The proportion of young adults (those between the ages of 15 and 24) who made online bill payments within the previous 12 months
12. Young adults (15â24 years old) who have saved to launch, run, or grow a farm or business
13. Young people (percentage of those aged 15â24) with outstanding house loans
14. Young adults (age 15â24) who borrow money to establish, run, or grow a farm or business
Statement of the Problem
World Findex report (2017) observed that among the many barriers that young people in Botswana face when trying to access financing are financial institutions' distance (15%), lack of identification documents (19%), lack of trust in financial institutions (17%), religious reasons (18%), insufficient funds (61%), and other issues. Therefore, the goal of the study is to identify the particular traits of young people that prevent them from obtaining financing.
Research Questions
Main research questions
What are the impediments to youth financial Inclusion in Botswana?
The sub-research questions
How does lack of entrepreneurial education influence access to youth financing in Botswana?
How does Socio-Cultural Factors Influences Access to youth financing in Botswana?
What are the factors that influence youth access to entrepreneurship funds?
Research Objectives
The study's objectives were to:
Examine barriers to youth financial access in Botswana
Ascertain the impact of a lack of entrepreneurial education on youth financing access in Botswana
Find out how sociocultural elements affect Botswana's youth funding availability
Examine the variables that affect young people's access to startup capital.
Research Hypothesis
Furthermore, the study involved testing the hypothesis and the following were the null hypothesis and alternative hypotheses applied in the study.
Null Hypotheses
Youth characteristics are not significantly and positively correlated with impediments to youth financial inclusion.
Alternative Hypothesis
Youth characteristics are significantly and positively correlated with impediments to youth financial inclusion.
Materials and Methods
Theoretical Framework for the study
The studyâs theoretical framework identified the barriers to young financial inclusion in Botswana and was based on the consumer choice theory. Three techniques are taken into consideration under the consumer choice theory: individual-level demand and supply, national-level demand and supply, and individual-level consumer choice theory. These methods are employed to draw attention to the different dynamics and limitations of financial inclusion (King, 2014).
The consumer choice theory served as the study's theoretical foundation since it can be used to explain how salaries impact labour supply, how interest rates impact household savings, and why demand curves may slope upward.
Conceptual Framework for the study
The conceptual framework for the study was based on the following concepts which assisted in informing the research design of the study, as shown in Figure 1. below.
 | Figure 1: Conceptual Framework for study, Source: Authors, 2024.
|
Literature Review
The barriers to youth financial access
It was discovered that there was a significant correlation between regulatory frameworks and youth enterprise development fund access in a Kenyan study on the obstacles impacting youth access to the fund. A favorable correlation between access to youth enterprise development funds and a lack of entrepreneurship training was also found by the study. In the same study, sociocultural characteristics and youth enterprise development funds were found to be positively correlated (Wohoro, 2018).
United Nations Capital Development Fund (UNCDF) (2012) observed that young people encounter the following obstacles in obtaining and using formal financial services (Hopkins et al., 2012);
limitations imposed by laws and regulations, such as minimum age and identity requirements. The most frequent obstacle to young people's access to financial services was the minimum age requirement, which is often 16 or 18 years old, to open and conduct transactions in a savings account. Since at least 70% of children in the world's least developed nations lack birth or registration certificates, the identification requirements made the age requirements harsher, especially for children and teenagers.
Services provided by Financial Services Providers (FSPs) that are inaccessible and inappropriate. High opening and minimum balance requirements, fees for withdrawals or deposits, inconvenient financial services situated too far from communities where youth reside, and a lack of motivation to open and use savings accounts were considered the main obstacles in the design and delivery of youth financial services.
Poor financial capacities of youth. Financial capability, according to the U.S. Treasury Department and the FINRA Investor Education Foundation (2009), is the set of abilities, dispositions, and knowledge that people need to make wise personal financial decisions that are appropriate for their social and economic situations.
According to a global study, 20% of the world's unbanked people cited distance as a major obstacle to financial inclusion. Additionally, 31% of people in sub-Saharan Africa cited distance as a major obstacle to accessing financial services Klapper et al. (2012). Furthermore, according to the report on banking reform, there were only five or fewer bank branches per 100,000 people in Kenya, Tanzania, Uganda, Mozambique, Zambia, and Ghana. (Boateng, 2015)
Entrepreneurial education affects youth access to financing
Chinomona et al. (2020) stressed that young people should have access to financing, training from the government and other non-governmental organizations, and an improvement in their ability for entrepreneurship. A sample of 365 data points gathered from South African universities in the Gauteng province served as the basis for the study. Four hypotheses served as the foundation for the investigation. The study's findings confirmed that young entrepreneurship at universities is significantly influenced favourably by entrepreneurial training, financial access, entrepreneurial capacity, and entrepreneurial climate.
Swota et al. (2022) noted that entrepreneurial capacity is favorably influenced by entrepreneurial self-efficacy, attitude toward entrepreneurship, and perceived availability to financing. Entrepreneurial intentions were found to be positively impacted by additional entrepreneurial ability (ibid). A cross-sectional survey of 347 young people enrolled in five Botswana universities served as the basis for the study. The data was subjected to structural equation modelling.
Socio-cultural factors affect youth access to financing.
Rural youth are less likely to be financially included, according to the Organization for Economic Cooperation and Development [OECD, 2020]. According to financial services providers, the youngest individuals who are most difficult to serve are those who reside in rural locations that are inaccessible by the current banking infrastructure Gasparri et al. (2019). According to the OECD (2020), the primary characteristics of young people who are financially excluded are as follows: they are concentrated in low-income countries, such as those in Sub-Saharan Africa, the Middle East, North Africa, Latin America, and the Caribbean; they belong to the nation's poorest 40% or socioeconomically disadvantaged backgrounds; they are unemployed or do not participate in the labour market; they are less educated; they are female; and they live in rural areas.
The youth characteristics that influence access to financing.
According to a survey conducted by UNCDF Youth Start survey, young people do not save in formal financial institutions because of the high minimum balances required to maintain account activity, the complicated and expensive processes to open an account, and the unclear and expensive transaction fees. Furthermore, it was shown that young people prefer accounts with no monthly fees because most of them lack consistent, reliable sources of income. The study also found that young people over the age of 18 desire to be able to get loans to invest in fixed assets or to begin and grow income-generating ventures. Finally, the survey verified that young people desired the freedom to access their accounts at any time (Hopkins et al., 2012).
Research and Methodology
The methodology of the study was based on quantitative research involving conducting a research survey on the impediments to youth financial inclusion in Botswana. This concurs with the research methodology that was applied in similar studies conducted by UNCDF through a Youth Start survey (Hopkins et al., 2012). Structured questionnaires were administered in the survey to collect data from the respondents. Closed ended questionnaires were deployed in gathering the data for the research. The research design for the study was quantitative descriptive research. Insights opinion (2023) described quantitative descriptive research as having some important characteristics that makes it a valuable method for businesses to understand their market and customers. It is further reiterated that quantitative descriptive research that apply statistical analysis involving numerical data, structured questionnaires and large samples.
Further, the benefit of quantitative descriptive research is regarding its predictability, replicability and that the results can be generalized over the entire population (ibid). Hence this study applied quantitative descriptive research involving a large sample of 800 questionnaires and deployed SPSS to analyse the data that was collected from the research survey.
The major limitation of quantitative research was observed as providing superficial representations ignoring feelings and opinions. Further it is reiterated that quantitative research can be over manipulated leading to inaccurate conclusions (Survey Monkey, n.d).
Data Collection and Research Instruments
The research used closed ended structured questionnaire. Nicholas (2009) affirmed that structured questionnaires provided respondents with the same set of pre-formulated questions. The structured questionnaires were assigned a Linkert scale to facilitate the data processing through statistical package for social science (SPSS) software. Easy usage, the ability to employ sophisticated statistical techniques, the ability to use ordinal data, and the provision of an alternative to yes/no response options were some advantages of employing a Linkert scale (Monette et al., 2014). According to Bajpai (2009), the Linkert scale has been promoted as inspiring trust in the interviewee, being dependable in comparison to other research methodologies by offering adequate insight into the interviewee's viewpoint, and being applicable across a range of fields.
The data collected was subjected to reliability analysis including computation of a Cronbachâs Alpha in ascertaining the sufficiency and internal consistency of the data scale items Nunnally et al. (1994). The detailed results of the reliability analysis are presented in Table 2 and 3 below.
Reliability Analysis for the Data Items Measuring the Impediments to Financial Inclusion
All the data items of the study were subjected to reliability analysis and achieved a Cronbachâs Alpha of 0.793 exceeding a minimum required of 0.7, indicating sufficient internal consistent reliability of the scale items, as shown in table 7 and table 8 below. George et al. (2003) suggested a tiered approach to the interpretation of the Cronbachâs Alpha comprising of the following: ? 0 .9 â Excellent, ? 0.8 â Good, ? 0.7 â Acceptable, ? 0.6 â Questionable, ? 0.5 â Poor, and ? 0.5 â Unacceptable.
Table 2: Reliability Analysis of All the Data Items
Reliability Statistics | |
Cronbach's Alpha | N of Items |
0.793 | 31 |
Source: Authors, 2024
Table 3: Items Total Statistics
Item-Total Statistics | ||||
Item | Scale Mean if Item Deleted | Scale Variance if Item Deleted | Corrected Item-Total Correlation | Cronbach's Alpha if Item Deleted |
A26 | 101.20 | 208.821 | 0.356 | 0.784 |
A27 | 100.95 | 215.016 | 0.254 | 0.789 |
A28 | 100.90 | 211.755 | 0.233 | 0.791 |
A29 | 101.20 | 208.521 | 0.417 | 0.782 |
A30 | 101.00 | 207.660 | 0.452 | 0.781 |
A31 | 101.60 | 208.901 | 0.345 | 0.785 |
A1 | 101.55 | 213.514 | 0.298 | 0.787 |
A2 | 100.80 | 226.243 | -0.065 | 0.803 |
A3 | 100.55 | 233.740 | -0.311 | 0.806 |
A4 | 100.50 | 224.531 | -0.009 | 0.798 |
A5 | 101.15 | 218.200 | 0.164 | 0.792 |
A6 | 101.75 | 217.760 | 0.163 | 0.792 |
A7 | 101.90 | 208.050 | 0.384 | 0.783 |
A8 | 101.20 | 213.327 | 0.339 | 0.786 |
A9 | 100.80 | 216.030 | 0.284 | 0.788 |
A10 | 101.25 | 204.243 | 0.415 | 0.781 |
A11 | 101.05 | 213.615 | 0.382 | 0.785 |
A12 | 101.20 | 215.129 | 0.388 | 0.785 |
A13 | 100.80 | 214.628 | 0.204 | 0.791 |
A14 | 101.50 | 213.517 | 0.291 | 0.787 |
A15 | 100.90 | 206.248 | 0.495 | 0.779 |
A16 | 101.10 | 198.538 | 0.655 | 0.770 |
A17 | 101.15 | 197.474 | 0.630 | 0.770 |
A18 | 101.50 | 208.411 | 0.380 | 0.783 |
A19 | 100.60 | 203.394 | 0.498 | 0.777 |
A20 | 101.60 | 214.809 | 0.225 | 0.790 |
A21 | 101.05 | 210.611 | 0.418 | 0.783 |
A22 | 100.70 | 205.467 | 0.463 | 0.779 |
A23 | 101.00 | 214.568 | 0.235 | 0.790 |
A24 | 101.20 | 217.832 | 0.109 | 0.797 |
A25 | 101.35 | 219.502 | 0.084 | 0.797 |
Source: Authors, 2024
Results
The results are presented in terms of demographic analysis and objectives of the study in the form of descriptive statistics as laid out in the next subsections.
Demographic Analysis for the study
Table 4 to Table 8 contains demographic data for the study. 75% of the participants of the study were males and 25% were females as shown in table 4 below. 45% of the participants were within the 21 to 23 years age group, 30% were within the 18 to 20 years age group, 20% were within the 24 to 26 years age group and 5% were of 27 years and above as shown in table 5 below. 75% of the participants were holders of a certificate, 10% had a bachelor, 10% were below certificate and 5% had a diploma as shown in table 6 below. 60% of the participants had entrepreneurial experience of between 0 to 3 months, 20% had entrepreneurial experience of between 1 and 2 years and 5% had an entrepreneurial experience of 3 years and above as shown in table 7 below. 80% of the participants had between 0 to 3 months of exposure to a specific youth fund and 15% of the participants were exposed to a specific fund experience as shown below in table 8 below.
Table 4: Gender
Gender (D1) | |||||
Mode | % | %Valid | % Cumulative | ||
Valid | Male | 600 | 75 | 75 | 75 |
Female | 200 | 25 | 25 | 100 | |
Total | 800 | 100 | 100 | ||
Source: Authors, 2024
Table 5: Age
Age (D2) | |||||
Mode | % | %Valid | % Cumulative | ||
Valid | 18-20 | 240 | 30 | 30 | 30 |
21-23 | 360 | 45 | 45 | 75 | |
24-26 | 160 | 20 | 20 | 95 | |
27 and above | 40 | 5 | 5 | 100 | |
Total | 800 | 100 | 100 | ||
Source: Authors, 2024
Table 6: Level of Education
Level of Education (D3) | |||||
Mode | % | % Valid | % Cumulative | ||
Valid | Below Certificate | 80 | 10 | 10 | 10 |
Certificate | 600 | 75 | 75 | 85 | |
Diploma | 40 | 5 | 5 | 90 | |
Bachelors' Degree | 80 | 10 | 10 | 100 | |
Total | 800 | 100 | 100 | ||
Source: Authors, 2024
Table 7: Entrepreneurial Experience
Entrepreneurial Experience (D4) | |||||
Mode | % | %Valid | % Cumulative | ||
Valid | 0-3 | 480 | 60 | 60 | 60 |
4-6 | 40 | 5 | 5 | 65 | |
7-9 | 40 | 5 | 5 | 70 | |
10-12 | 40 | 5 | 5 | 75 | |
1-2 years | 160 | 20 | 20 | 95 | |
3years and above | 40 | 5 | 5 | 100 | |
Total | 800 | 100 | 100 | ||
Source: Authors, 2024
Table 8: Specific Youth Fund Experience
Specific Youth Fund Experience (D5) | |||||
Mode | % | %Valid | % Cumulative | ||
Valid | 0-3 | 640 | 80 | 80 | 80 |
7-9 | 120 | 15 | 15 | 95 | |
Above 1 year | 40 | 5 | 5 | 100 | |
Total | 800 | 100 | 100 | ||
Source: Authors, 2024
Impediments to Youth Financial Inclusion-Descriptive Statistics
Descriptive statistics for the impediments to youth financial inclusion were laid out from Table 9 to Table 17 below.
35% of the participants understood the procedures required for registering for youth fund as shown in Table 9 below. 60% participants indicated that youth funds have complex registration procedures as shown in Table 10 below. 70% participants revealed that procedures for business registration are an obstacle to accessing youth funds as reflected in Table 11 below. 65% of the participants indicated that the procedures for business registration need to be changed as shown in Table 12 below. The results concurs with the findings of Hopkins et al. (2012).
55% of the participants were aware of the age requirements for the registration of youth funds as shown in Table 13 below. 75% of the youth indicated that documentation of proof of age was not a hindrance to accessing youth fund as shown in Table 14 below. 70% of the youth did not comprehend the business licensing process as shown in Table 15 below. 55% of the youth revealed that the cost of business licence is not high as shown in Table 16 below. 50% of the youth indicated that licencing costs hinders access to entrepreneurial funds as shown in Table 17 below. The results are in tandem with those of Hopkins et al. (2012).
The following abbreviations were used for Likert scales used in the tables below; SDA-Strongly Disagree, DSA-Disagree, NEU-Neutral, ADR-Agree and SA-Strongly Agree.
Table 9: Procedures for registering for youth funds
You understand the procedures for registering for youth funds (A1) | |||||
Mode | % | %Valid | % Cumulative | ||
Valid | SDA | 120 | 15 | 15 | 15 |
DSA | 160 | 20 | 20 | 35 | |
NEU | 240 | 30 | 30 | 65 | |
AGR | 200 | 25 | 25 | 90 | |
SA | 80 | 10 | 10 | 100 | |
TOTAL | 800 | 100 | 100 | ||
Source: Authors, 2024
Table 10: Youth Funds Complex Registration Procedures
Youth funds have complex registration procedures (A2) | |||||
Mode | % | %Valid | % Cumulative | ||
Valid | SDA | 80 | 10 | 10 | 10 |
DSA | 80 | 10 | 10 | 20 | |
NEU | 160 | 20 | 20 | 40 | |
AGR | 160 | 20 | 20 | 60 | |
SA | 320 | 40 | 40 | 100 | |
TOTAL | 800 | 100 | 100 | ||
Source: Authors, 2024
Table 11: Procedural Hindrance to Accessing Youth Funds
The procedures are a hindrance to accessing youth funds (A3) | |||||
Mode | % | %Valid | % Cumulative | ||
Valid | SDA | 80 | 10 | 10 | 10 |
DSA | 160 | 20 | 20 | 30 | |
NEU | 280 | 35 | 35 | 65 | |
AGR | 280 | 35 | 35 | 100 | |
SA | 800 | 100 | 100 | ||
Source: Authors, 2024
Table 12: Registration Procedures requiring Change
The registration procedures need to be changed (A4) | |||||
Mode | % | %Valid | % Cumulative | ||
Valid | SDA | 40 | 5 | 5 | 5 |
DSA | 240 | 30 | 30 | 35 | |
NEU | 160 | 20 | 20 | 55 | |
AGR | 360 | 45 | 45 | 100 | |
SA | 800 | 100 | 100 | ||
Source: Authors, 2024
Table 13: Age Requirements for Youth Funds
You understand the age requirements for youth funds (A5) | |||||
Mode | % | %Valid | % Cumulative | ||
Valid | SDA | 80 | 10 | 10 | 10 |
DSA | 120 | 15 | 15 | 25 | |
NEU | 160 | 20 | 20 | 45 | |
AGR | 320 | 40 | 40 | 85 | |
SA | 120 | 15 | 15 | 100 | |
TOTAL | 800 | 100 | 100 | ||
Source: Authors, 2024
Table 14: Documentation for Proof of Age as Hindrance to Accessing Youth Funds
Documentation for proof of age is a hindrance in accessing youth funds (A6) | |||||
Mode | % | %Valid | % Cumulative | ||
Valid | SDA | 200 | 25 | 25 | 25 |
DSA | 80 | 10 | 10 | 35 | |
NEU | 320 | 40 | 40 | 75 | |
AGR | 120 | 15 | 15 | 90 | |
SA | 80 | 10 | 10 | 100 | |
TOTAL | 800 | 100 | 100 | ||
Source: Authors, 2024
Table 15: Understanding Business Licensing Process
You understand business licensing process (A7) | |||||
Mode | % | %Valid | % Cumulative | ||
Valid | SDA | 200 | 25 | 25 | 25 |
DSA | 280 | 35 | 35 | 60 | |
NEU | 80 | 10 | 10 | 70 | |
AGR | 120 | 15 | 15 | 85 | |
SA | 120 | 15 | 15 | 100 | |
TOTAL | 800 | 100 | 100 | ||
Source: Authors, 2024
Table 16: High Cost of Business Licence
The cost of business licencing is high for the youth (A8) | |||||
Mode | % | %Valid | % Cumulative | ||
Valid | SDA | 40 | 5 | 5 | 5 |
DSA | 160 | 20 | 20 | 25 | |
NEU | 240 | 30 | 30 | 55 | |
AGR | 240 | 30 | 30 | 85 | |
SA | 120 | 15 | 15 | 100 | |
TOTAL | 800 | 100 | 100 | ||
Source: Authors, 2024
Table 17: Licencing costs hinders access to youth entrepreneurship fund
Licencing costs hinders access to youth entrepreneurship fund (A9) | |||||
Mode | % | %Valid | % Cumulative | ||
Valid | SDA | 80 | 10 | 10 | 10 |
DSA | 320 | 40 | 40 | 50 | |
NEU | 160 | 20 | 20 | 70 | |
AGR | 240 | 30 | 30 | 100 | |
SA | 800 | 100 | 100 | ||
TOTAL | |||||
Source: Authors, 2024
Entrepreneurial education affects youth access to financing-Descriptive Statistics
Descriptive statistics for entrepreneurial education are presented from Table 18 to Table 24.
50% of the youth agreed that they have access to financial training as shown in Table 18. 60% of the youth disagreed that financial training included cost structure of the business as shown in Table 19.65% disagreed that financial training included revenue structure of a business as shown in Table 20. 65% of the youth agreed that financial training is essential for accessing youth entrepreneurship funds as shown in Table 21. This outcome concurs with the findings of Swota et al. (2022).
70% of the youth indicated that they had no access to IT training for youth entrepreneurship as shown below in Table 22. 50% of the youth revealed that IT training included online marketing as shown in Table 23. The result is in agreement with the findings of Chinomona et al. (2020). However, 55% of the youth disagreed that IT training enhances access to entrepreneurship funds as shown in Table 24.
Table 18: Youth Access to Financial Training
As a youth you have access to financial training (A10). | |||||
Mode | % | %Valid | % Cumulative | ||
Valid | SDA | 160 | 20 | 20 | 20 |
DSA | 160 | 20 | 20 | 40 | |
NEU | 80 | 10 | 10 | 50 | |
AGR | 120 | 15 | 15 | 65 | |
SA | 280 | 35 | 35 | 100 | |
TOTAL | 800 | 100 | 100 | ||
Source: Authors, 2024
Table 19: Financial training includes cost structure of a business
Financial training includes cost structure of a business (A11) | |||||
Mode | % | %Valid | % Cumulative | ||
Valid | SDA | 120 | 15 | 15 | 15 |
DSA | 360 | 45 | 45 | 60 | |
NEU | 160 | 20 | 20 | 80 | |
AGR | 160 | 20 | 20 | 100 | |
SA | 800 | 100 | 100 | ||
TOTAL | |||||
Source: Authors, 2024
Table 20: Financial training includes revenue structure of a business
Financial training includes revenue structure of a business (A12) | |||||
Mode | % | %Valid | % Cumulative | ||
Valid | SDA | 120 | 15 | 15 | 15 |
DSA | 400 | 50 | 50 | 65 | |
NEU | 200 | 25 | 25 | 90 | |
AGR | 80 | 10 | 10 | 100 | |
SA | 800 | 100 | 100 | ||
TOTAL | |||||
Source: Authors, 2024
Table 21: Financial training is essential for accessing youth entrepreneurship funds
Financial training is essential for accessing youth entrepreneurship funds (A13) | |||||
Mode | % | %Valid | % Cumulative | ||
Valid | SDA | 120 | 15 | 15 | 15 |
DSA | 40 | 5 | 5 | 20 | |
NEU | 160 | 20 | 20 | 40 | |
AGR | 120 | 15 | 15 | 55 | |
SA | 360 | 45 | 45 | 100 | |
TOTAL | 800 | 100 | 100 | ||
Source: Authors, 2024
Table 22: Youth Access to IT training for Youth Entrepreneurship
You have access to IT training for youth entrepreneurship (A14) | |||||
Mode | % | %Valid | % Cumulative | ||
Valid | SDA | 120 | 15 | 15 | 15 |
DSA | 120 | 15 | 15 | 30 | |
NEU | 320 | 40 | 40 | 70 | |
AGR | 120 | 15 | 15 | 85 | |
SA | 120 | 15 | 15 | 100 | |
TOTAL | 800 | 100 | 100 | ||
Source: Authors, 2024
Table 23: I.T Training Includes Online Marketing
I.T training includes online marketing (A15) | |||||
Mode | % | %Valid | % Cumulative | ||
Valid | SDA | 40 | 5 | 5 | 5 |
DSA | 120 | 15 | 15 | 20 | |
NEU | 240 | 30 | 30 | 50 | |
AGR | 120 | 15.0 | 15.0 | 65 | |
SA | 280 | 35 | 35 | 100 | |
TOTAL | 800 | 100 | 100 | ||
Source: Authors, 2024
Table 24: I.T training enhances access to youth entrepreneurship funds
I.T training enhances access to youth entrepreneurship funds (A16) | |||||
Mode | % | %Valid | % Cumulative | ||
Valid | SDA | 120 | 15 | 15 | 15 |
DSA | 40 | 5 | 5 | 20 | |
NEU | 280 | 35 | 35 | 55 | |
AGR | 120 | 15 | 15 | 70 | |
SA | 240 | 30 | 30 | 100 | |
TOTAL | 800 | 100 | 100 | ||
Source: Authors, 2024
Socio-cultural factors affect youth access to financing.
Descriptive statistics for socio cultural factors are displayed from Table 26 to Table 33 below.
55% of the youth do not belong to a religion as shown in table 25. 60% of the youth disagreed that religion influences how to engage in entrepreneurship as shown in Table 26 below. This outcome is in contrast to Swota et al. (2022).
In addition, 65% of the youth comprehend their cultural values as shown in Table 27 below. 65% of the youth disagreed that cultural values influence entrepreneurship ventures as shown in table 28 below. 50% of the youth agreed that cultural capital is essential at succeeding in entrepreneurship ventures as shown in Table 28 below. This outcome is in agreement with the findings of the OECD (2020).
Moreso, 65% of the youth indicated family support as essential to entrepreneurship success as shown in Table 30 below. 55% of the youth agreed that entrepreneurship funds are accessed through family connections as shown in Table 31 below.
50% of the youth agreed that peer influences attitude towards youth entrepreneurship and that peers use their influence to help other youth access youth funds as shown in Table 32 and Table 33 below.
Table 25: Religion
You are a religious person (A17) | |||||
Mode | % | %Valid | % Cumulative | ||
Valid | SDA | 120 | 15 | 15 | 15 |
DSA | 120 | 15 | 15 | 30 | |
NEU | 200 | 25 | 25 | 55 | |
AGR | 80 | 10 | 10 | 65 | |
SA | 280 | 35 | 35 | 100 | |
Total | 800 | 100 | 100 | ||
Source: Authors, 2024
Table 26: Religion influences entrepreneurship
Religion influences how you engage in entrepreneurship (A18) | |||||
Mode | % | %Valid | % Cumulative | ||
Valid | SDA | 120 | 15 | 15 | 15 |
DSA | 240 | 30 | 30 | 45 | |
NEU | 120 | 15 | 15 | 60 | |
AGR | 160 | 20 | 20 | 80 | |
SA | 160 | 20 | 20 | 100 | |
TOTAL | 800 | 100 | 100 | ||
Source: Authors, 2024
Table 27: Cultural Values
You understand your cultural values (A19) | |||||
Mode | % | %Valid | % Cumulative | ||
Valid | SDA | 80 | 10 | 10 | 10 |
DSA | 80 | 10 | 10 | 20 | |
NEU | 120 | 15 | 15 | 35 | |
AGR | 80 | 10.0 | 10.0 | 45 | |
SA | 440 | 55 | 55 | 100 | |
TOTAL | 800 | 100 | 100 | ||
Source: Authors, 2024
Table 28: cultural values Influences entrepreneurship Ventures
Your cultural values Influences your entrepreneurship Ventures (A20) | |||||
Mode | % | %Valid | % Cumulative | ||
Valid | SDA | 160 | 20 | 20 | 20 |
DSA | 160 | 20 | 20 | 40 | |
NEU | 200 | 25 | 25 | 65 | |
AGR | 160 | 20 | 20 | 85 | |
SA | 120 | 15 | 15 | 100 | |
TOTAL | 800 | 100 | 100 | ||
Source: Authors, 2024
Table 29: Cultural capital is important to success of entrepreneurship
Your cultural capital is important to success of entrepreneurship (A21) | |||||
Mode | % | %Valid | % Cumulative | ||
Valid | SDA | 40 | 5 | 5 | 5 |
DSA | 120 | 15 | 15 | 20 | |
NEU | 240 | 30 | 30 | 50 | |
AGR | 240 | 30 | 30 | 80 | |
SA | 160 | 20 | 20 | 100 | |
TOTAL | 800 | 100 | 100 | ||
Source: Authors. 2024
Table 30: Family support is essential to youth entrepreneurship success
Family support is essential to youth entrepreneurship success (A22) | |||||
Mode | % | %Valid | % Cumulative | ||
Valid | SDA | 80 | 10 | 10 | 10 |
DSA | 80 | 10 | 10 | 20 | |
NEU | 120 | 15 | 15 | 35 | |
AGR | 160 | 20 | 20 | 55 | |
SA | 360 | 45 | 45 | 100 | |
TOTAL | 800 | 100 | 100 | ||
Source: Authors, 2024
Table 31: Importance of Family Connections to Access Youth Funds
You get youth funds based on family connections (A23) | |||||
Mode | % | %Valid | % Cumulative | ||
Valid | SDA | 80 | 10 | 10 | 10 |
DSA | 120 | 15 | 15 | 25 | |
NEU | 160 | 20 | 20 | 45 | |
AGR | 200 | 25 | 25 | 70 | |
SA | 240 | 30 | 30 | 100 | |
TOTAL | 800 | 100 | 100 | ||
Source: Authors, 2024
Table 32: Peers influence your attitude towards youth entrepreneurship
Your peers influence your attitude towards youth entrepreneurship (A24) | |||||
Mode | % | %Valid | % Cumulative | ||
Valid | SDA | 120 | 15 | 15 | 15 |
DSA | 240 | 30 | 30 | 45 | |
NEU | 40 | 5 | 5 | 50 | |
AGR | 80 | 10 | 10 | 60 | |
SA | 320 | 40 | 40 | 100 | |
TOTAL | 800 | 100 | 100 | ||
Source: Authors, 2024
Table 33: Usage of Peers Influence to Access Youth Funds
Your peers use their influence to help you access youth funds (A25) | |||||
Mode | % | %Valid | % Cumulative | ||
Valid | SDA | 160 | 20 | 20 | 20 |
DSA | 160 | 20 | 20 | 40 | |
NEU | 80 | 10 | 10 | 50 | |
AGR | 200 | 25 | 25 | 75 | |
SA | 200 | 25 | 25 | 100 | |
TOTAL | 800 | 100 | 100 | ||
Source: Authors, 2024
The youth characteristics that influence access to financing.
Descriptive statistics for youth characteristics are composed from Table 34 to Table 39 below.
55% of the youth indicated the importance of youth training in accessing bank credits or loans, at lower interest rates as shown in Table 34, Table 35 and Table 36 below. This resonates with the findings of Hopkins et al. (2012). Furthermore, 60% of the youth indicated that regulatory frameworks for youth funds do not influence access to entrepreneurial funds as shown in Table 37 below.
In addition, 40% of the youth indicated that limited knowledge on youth needs does influence access to entrepreneurial funds as shown in Table 38 below. 60% of the youth indicated that youth have no access to CEDA funds, Financial Assistance Programme (FAP) funds, E-nnovation youth empowerment programme (eYEP) and Youth Development Fund or to any other youth funds as shown in Table 39 below.
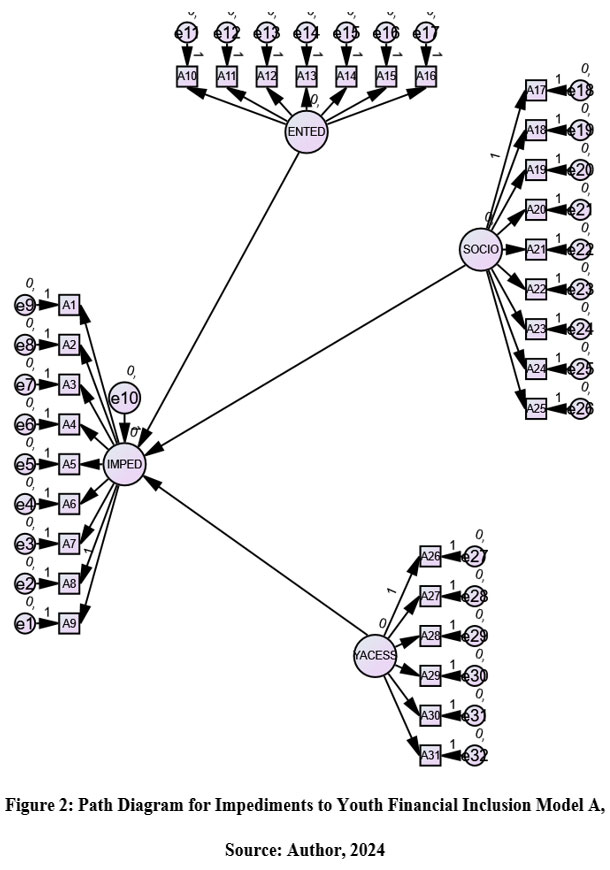
Further running the data through Analysis of Moments Structures (AMOS) indicated that there is no significant correlation between Impediments to youth financial inclusion with financial training, IT training, role of religion, cultural values, role of family and the success of entrepreneurship as shown in Figure 2 below. However, this is in contrast to the studies of Wohoro (2018) and Chinomona et al. (2020). Hence both the null and alternative hypotheses were rejected for this study.
Table 34: Youth Access to Bank Credits/Loans
Youth have access to bank credits/loans (A26) | |||||
Mode | % | %Valid | % Cumulative | ||
Valid | SDA | 120 | 15 | 15 | 15 |
DSA | 160 | 20 | 20 | 35 | |
NEU | 80 | 10 | 10 | 45 | |
AGR | 240 | 30 | 30 | 75 | |
SA | 200 | 25 | 25 | 100 | |
TOTAL | 800 | 100 | 100 | ||
Source: Authors, 2024
Table 35: Lower Interest Rate on Youth Funds
Youth funds have lower interest rates (A27) | |||||
Mode | % | %Valid | % Cumulative | ||
Valid | SDA | 80 | 10.0 | 10.0 | 10.0 |
DSA | 40 | 5.0 | 5.0 | 15.0 | |
NEU | 240 | 30.0 | 30.0 | 45.0 | |
AGR | 240 | 30.0 | 30.0 | 75.0 | |
SA | 200 | 25.0 | 25.0 | 100.0 | |
TOTAL | 800 | 100.0 | 100.0 | ||
Source: Authors, 2024
Table 36: The importance of Youth Training in Accessing Youth Funds
Youth training is important to accessing youth funds (A28) | |||||
Mode | % | %Valid | % Cumulative | ||
Valid | SDA | 120 | 15 | 15 | 15 |
DSA | 160 | 20 | 20 | 35 | |
NEU | 80 | 10 | 10 | 45 | |
AGR | 440 | 55 | 55 | 100 | |
SA | 800 | 100 | 100 | ||
TOTAL | 100 | 100 | |||
Source: Authors, 2024
Table 37: Regulatory frameworks for youth funds influence access to the fund
Regulatory frameworks for youth funds influence access to the fund (A29) | |||||
Mode | % | %Valid | % Cumulative | ||
Valid | SDA | 80 | 10 | 10 | 10 |
DSA | 120 | 15 | 15 | 25 | |
NEU | 280 | 35 | 35 | 60 | |
AGR | 120 | 15 | 15 | 75 | |
SA | 200 | 25 | 25 | 100 | |
TOTAL | 800 | 100 | 100.0 | ||
Source: Authors, 2024
Table 38: Limited knowledge on Youth Needs
Limited knowledge on youth needs (A30) | |||||
Mode | % | %Valid | % Cumulative | ||
Valid | SDA | 40 | 5 | 5 | 5 |
DSA | 120 | 15 | 15 | 20 | |
NEU | 320 | 40 | 40 | 60 | |
AGR | 40 | 5 | 5 | 65 | |
SA | 280 | 35 | 35 | 100 | |
TOTAL | 800 | 100 | 100 | ||
Source: Authors, 2024
Table 39: Access to Youth Funds
Youth have access to CEDA, funds/ Financial Assistance Programme (FAP) funds/e-novation youth empowerment programme (eYEP)/ Youth Development Fund or any other youth funds (A31). | |||||
Mode | % | %Valid | % Cumulative | ||
Valid | SDA | 160 | 20 | 20 | 20 |
DSA | 240 | 30 | 30 | 50 | |
NEU | 80 | 10 | 10 | 60 | |
AGR | 160 | 20 | 20 | 80 | |
SA | 160 | 20 | 20 | 100 | |
TOTAL | 800 | 100 | 100 | ||
Source: Authors, 2024
 |
Discussions
In Botswana a greater number of youths have access to bank loans and credits. Regulatory frameworks for youth funds influence access to entrepreneurship funds. This concurs with the findings of Hopkins et al. (2012) and Swota et al. (2022). Youth in Botswana are regarded as adequately documented and proof of age has been ruled out as an impediment to youth access to entrepreneurship funds. Family connections influence youth access to entrepreneurship funds. Furthermore, limited knowledge on youth needs has been observed as a significant impediment to youth accessing entrepreneurship funds.
Youth cultural values were observed as not exerting greater influence on youth entrepreneurship in Botswana. In Botswana religion and cultural values do not influence access of youth to entrepreneurship funds. Finally, there was no correlation between the impediments to youth financial access with enablers of youth financial access, enablers of youth entrepreneurship skills and social cultural values as shown in the path diagram above Model A above (Figure 2). This in in contrast to the findings of Chinomona et al. (2020) and Wohoro (2018).
Conclusion
Business licensing procedures and the procedures for business registration in Botswana have been observed as significant hindrance to accessing youth funds in the country (OECD, 2020). In Botswana a greater number of youths have access to bank loans and credits and regulatory frameworks for youth funds influence access to entrepreneurship funds.
Furthermore, limited knowledge on youth needs has been observed as a significant impediment to youth accessing entrepreneurship funds. Youth in Botswana are regarded as adequately documented and proof of age has been ruled out as an impediment to youth access to entrepreneurship funds. Family connections influence youth access to entrepreneurship funds.
The procedures for business registration should be changed to facilitate the âease of doingâ business by the youths particularly focusing the rural youths of Botswana. This is aligned to the sentiments of Klapper et al. (2012), Gasparri et al. (2019), Chinomona et al. (2020) and OECD (2020). Policy makers should initiate marketing campaigns to raise awareness of the age requirements for accessing youth entrepreneurship funds. The importance of youth training especially in Information Technology (IT) and business costing structures should be embraced in the remote areas, villages and mining towns to increase financial access and to enhance the success of youth enterprises. These sentiments are aligned to those for Chinomona et al. (2020) and Gasparri et al. (2019). The responsible authorities should ensure that the vetting and disbursement of youth entrepreneurship funds is objective and independent of family connections and free from political influence or any adverse selection and moral hazards.
Acknowledgement
The author would like to thank the Ministry of Finance for granting us with a research permit to conduct the research in the financial markets of Botswana. No materials were reproduced but the figures and tables produced were a direct output of the data that was processed through SPSS and AMOS for structural equation modeling.
Funding Sources
The author(s) received no financial support for the research, authorship, and/or publication of this article.
Conflicts of Interest
The author(s) do not have any conflict of interest.
Data Availability Statement
The data presented in this study are available on request from the corresponding author. The data are not publicly available due to restrictions.
Ethics Statement
This research did not involve animal subjects, or any material that requires ethical approval. However the research permit was applied for at the Botswana Ministry of Finance to enable administer survey questionnaires in Gaborone.
Informed Consent Statement
Informed consent was obtained from all subjects involved in the study.
Author Contributions
Wilbert Kudakwashe Chidaushe: Conceptualization, Methodology, Resources, WritingâReview and Editing.
Stegi Shine: Validation, Formal analysis, WritingâOriginal Draft Preparation, Writing-Review and Editing.
Mini Sebastian: Methodology, Formal Analysis, Investigation, Writing-Review and Editing.
References
- Bajpai, R.B. (2009). Research methodology: Techniques & trends. 1st-ed.-New-Delhi:APH-Publishing-Corporation. https://www.bagchee.com/books/BB42966/research-methodology-techniques-and-trends
- Boateng, L. (2015). Banking on Change: Breaking the Barriers to Financial Inclusion. Date Accessed 14 August 2024. https://www.rfilc.org/library/banking-on-change-breaking-barriers-to-financial-inclusion/
- Gasparri, A. and L. Munoz (2019), Inclusive finance and rural youth, IFAD research series. Date Accessed 27 September 2024. http://www.ifad.org/ruraldevelopmentreport.
CrossRef - George, D., & Mallery, P. (2003). SPSS for Windows step by step: A simple guide and reference. 11.0 update (4th ed.). Boston: Allyn & Bacon. https://www.scirp.org/reference/ReferencesPapers?ReferenceID=1457632
- Hopkins, D., Porter. B. & Perdomo, M. (2012). Policy Opportunities and Constraints to Access Youth Financial Services. The Master Card Foundation and United Nations Capital Development Fund.https://www.uncdf.org/article/572/policy-opportunities-and-constraints-to-access-youth-financial-services-migration.
- Insights Opinion (2023). Quantitative Descriptive Research. Date accessed 16 December 2024. https://insightsopinion.com/quantitative-research/quantitative-descriptive-research-characteristics-methods-and-examples/
- Klapper & Demirguc, K. (2012). Measuring Financial Inclusionâ, the World Bank Development Research Group, 2012.https://openknowledge.worldbank.org/entities/ publication/fd0322b0-985c-5836-8396-9ee61c45716c
- King M. (2014) A Conceptual Framework for Financial Inclusion and Recent Evidence for Sub-Saharan Africa. In: Brennan L. (eds) Enacting Globalization. Palgrave Macmillan, London. https://doi.org/10.1057/9781137361943_3.
CrossRef - Monette, D.R., Sullivan, T.J., DeJong, C.R. & Hilton, T.P. (2014). Applied social research. 9th-ed.-Belmont:-Brooks/Cole-Cengage-Learning. https://www.scirp.org/reference/referencespapers?referenceid=514386
- Nicholas, L. (2009). Introduction to psychology. 2nd ed. UCT-Press. https://repository.hsrc.ac.za/browse?type=subject&value=PSYCHOLOGY.
- Nunnally J.B.L and Beinstein I. H. (1994). Psychometric theory. New York: McGraw-Hill-Higher. https://www.scirp.org/reference/ReferencesPapers? ReferenceID=1017362
- OECD [2020]. Advancing the Financial Inclusion of Youth. Report prepared for the G20 Global Partnership for Financial Inclusion by the OECD. https://www.oecd.org/content/dam/oecd/ en/publications/reports/2020/07/advancing-the-digital-financial-inclusion-of-youth_2b049728/21b829d8-en.pdf
- Chinomona, E, Popoola, B. A & Popoola, O. O. (2020). The Influence of Entrepreneurial Training, Access to Finance, Entrepreneurial Capacity, Entrepreneurial atmosphere on Youth Entrepreneurship.
- African Journal of Business & Economic Research. https://www.proquest.com/docview/ 2396608653?sourcetype=Scholarly%20Journals
- Swota, T. D., Jaiyeoba, O. & Makanyeza, C. (2022). Perceived Access to Finance, Entrepreneurial Self-Efficacy, Attitude Toward Entrepreneurship, Entrepreneurial Ability, and Entrepreneurial Intentions: A Botswana Youth Perspective. https://repository.bothouniversity.ac.bw/buir/handle/123456789/230
- Sykes, J.,Elder, S., Gurbuzer, Y. & Principi, M. (2016). Exploring the linkages between youth financial inclusion and job creation: Evidence from the ILO school-to-work transition surveys. International Labour Office, Geneva. Accessed on 20/11/2024.
- Survey Monkey (n.d). 4 types of quantitative research and when to use them. Date accessed 17 December 2024. https://www.surveymonkey.com/market-research/resources/quantitative-research-types/
- Wohoro, F.N, (2018). Challenges affecting youth access to youth enterprise fund: A study of youth empowerment support services in Kenya. A Research Project Report submitted to the Chandaria School of Business in Partial Fulfillment of the Requirement for the Degree of Masters of Business Administration (MBA).
- World Financial Inclusion Index (Global Findex database), (2019). The World Bank Group. https://www.worldbank.org/ en/publication/globalfindex. Accessed on 20/11/2024.
Abbreviations
SDA-Strongly Disagree
DSA-Disagree
NEU-Neutral
ADR-Agree and
SA-Strongly Agree

This work is licensed under a Creative Commons Attribution 4.0 International License.


