
Navigating Success: How Good Governance Fuels Economic Development in Nepal
Udaya Rana Magar* 
1Joint Secretary, Government of Nepal .
http://dx.doi.org/10.12944/JBSFM.07.01.07
Good governance is essential for economic development in Nepal, particularly in combating corruption, which impedes financial progress. This study assesses governance levels and their correlation with GDP growth using descriptive analysis and Granger causality tests, drawing on Worldwide Governance Indicators (WGI) and data from the World Bank and Nepal's Central Bank from 2000 to 2020.
Trend analysis reveals significant fluctuations in governance indicatorsâsuch as voice and accountability, political stability, and regulatory qualityâlinked to political events, including changes in 2002, the 2015 earthquake, and the COVID-19 pandemic. The Granger causality test indicates that both control of corruption and regulatory quality significantly impact GDP growth. Prioritizing anti-corruption efforts is vital for enhancing democracy and political stability.
The studyâs results have important implications for policymakers, governments, international organizations, and aid donors, highlighting the need to prioritize anti-corruption measures, enhance accountability, and improve regulatory frameworks.
Copy the following to cite this article:
Magar U. R. Navigating Success: "How Good Governance Fuels Economic Development in Nepal". Journal of Business Strategy Finance and Management, 7(1).
DOI:http://dx.doi.org/10.12944/JBSFM.07.01.07Copy the following to cite this URL:
Magar U. R. Navigating Success: "How Good Governance Fuels Economic Development in Nepal". Journal of Business Strategy Finance and Management, 7(1).Available here: https://bit.ly/4b7FzKN
Download article (pdf) Citation Manager Publish History


Introduction
A nation is defined by its unique combination of human organization aimed at creating order and security through the enforcement of laws within specific territorial boundaries. Central to the progress of any country are the principles of good governance and development. Good governance, characterized by transparency, accountability, and citizen participation, is a crucial prerequisite for promoting economic growth and prosperity on a global scale (Johnston, 2002).
Economic development is a complex concept, with economic growth often seen as a key indicator of progress. Economic growth involves the rise in the production of goods and services over time, which can be evaluated through various measures, including Gross Domestic Product (GDP) and the Governance Index (Paitoon, 2018). These indicators are crucial in assessing a country's economic health, with effective governance playing a central role in promoting sustainable economic growth and overall development.
Good governance encompasses the frameworks and processes that shape political and socio-economic interactions, promote the rule of law, and ensure that public institutions manage resources efficiently and equitably. It also includes a strategic vision for long-term social progress that ensures marginalized groups access key resources. The principles of good governance are closely related to anti-corruption efforts, as both aim to create a policy environment that is participatory, transparent, and accountable
In the context of Nepal, a developing nation aiming to enhance its socio-economic standing, the pursuit of good governance is essential for achieving sustainable development. The government of Nepal has enacted several laws to promote good governance, including the Constitution of Nepal (2015) and the Prevention of Corruption Act (2002). Despite these legal frameworks, the practical implementation of good governance remains insufficient, with corruption continuing to pose a significant obstacle to progress. This is reflected in Nepal's ranking of 117th and a score of 33 on the Corruption Perceptions Index in 2020, alongside a decline in GDP growth from 8.9% in 2017 to -2.07% in 2020 (UNODC). Furthermore, in 2023, Nepal ranks 108th among 180 countries in the corruption index (Transparency International, 2020). These indicators highlight the persistent challenges that hinder the country's development efforts.
Economic growth in Nepal relies significantly on both the primary and service sectors, with remittances serving as a crucial source of economic support. According to Magar and Upadhyaya (2021), there exists a unidirectional causality between remittances and real GDP, indicating that remittances positively influence real GDP; specifically, an increase in remittances correlates with an increase in GDP. However, fluctuations in GDP do not seem to affect remittances.
Governance plays a vital role in a nation's development by promoting order, security, and progress. Good governance, defined by principles such as transparency, accountability, the rule of law, and active citizen involvement, is essential for driving economic growth and prosperity. This paper will examine the significant connection between good governance, economic growth, and development in Nepal, highlighting the importance of robust governance frameworks to combat corruption and foster economic progress.
In Nepal, while legal frameworks like the Good Governance Act and the Prevention of Corruption Act have been established, their implementation is lacking. This is reflected in Nepal's low position on the 2020 Corruption Perceptions Index and a decrease in GDP growth rate. Tackling corruption is crucial for achieving effective governance and advancing economic development.
Literature Reviews
Good governance is increasingly acknowledged as a key driver of economic development in countries at all levels of progress, including Nepal. It is believed that good governance plays a crucial role in fostering economic growth by enabling efficient development initiatives. This focus on economic advancement is online with the Millennium Development Goals (2007) set by the United Nations (2017), which highlight the importance of strong governance structures in achieving sustainable development results.
Fukuyama (2013) offers an in-depth examination of how to measure governance, defining it as the government's ability to enforce rules and provide essential services. He highlights two key aspects of governance: capacity and autonomy. By analyzing governance through various functions, regions, and levels, Fukuyama argues that a detailed evaluation of these dimensions can yield important insights into governance effectiveness. This framework is especially pertinent for assessing the governance situation in Nepal, where both capacity and autonomy are crucial for promoting economic growth.
The United Nations (2017) defines good governance as the efficient allocation and management of resources to benefit the public. This definition emphasizes the role of governments in delivering public goods and services while ensuring resources are distributed effectively. Consequently, good governance is closely tied to the provision of essential services, both formal and informal, which is vital for development in Nepal.
According to the World Bank (2017), although global development has made significant strides, it has also exacerbated income inequality and heightened vulnerabilities within the global economy. The report advocates for practical policies that yield positive development outcomes, emphasizing the need for improved governance as a remedy for contemporary global challenges. From this perspective, good governance is conceptualized as a process of policy implementation, guided by established rules, aimed at empowering individuals and communities to achieve specific economic outcomes.
Paitoon (2018) explores the relationship between good governance and economic growth in Thailand and several other Asian nations. It reveals that good governance substantially contributes to per capita income growth, capital growth, and total factor productivity. Notably, a one-percent improvement in the composite governance index correlates with an annual increase in per capita income of approximately $31.34. This finding underscores the critical role of good governance in driving economic growth, particularly in developing Asian nations like Nepal.
Kaufmann and Kraay (2002) support this connection by identifying a strong positive correlation between the quality of governance and per capita income. Their findings suggest that enhancements in governance practices are linked to higher income levels, while the reverse indicates that greater income does not automatically result in improved governance. This dynamic underscore the complexities of the interaction between governance and economic growth.
To measure good governance, the World Bank created the Worldwide Governance Indicators (WGI), which include six dimensions: Voice and Accountability, Political Stability and Absence of Violence/Terrorism, Government Effectiveness, Quality of Regulation, Rule of Law, and Control of Corruption. This framework is employed to assess the state of governance in Nepal in relation to economic growth, providing a new perspective on this often-overlooked topic. The following sections will explore the role of good governance in fostering economic development and examine the relationship between the governance index and GDP growth in Nepal.
Although previous research indicates that governance can significantly influence economic growth, there remains a significant gap in how to increase the attractiveness of governance-related policies to policymakers. The literature suggests that the relationship between governance and economic growth lacks robust empirical evidence. To facilitate effective policy interventions, it is essential to identify the key governance factors that affect economic growth.
Thus, this study aims to evaluate the impact of governance on economic growth in Nepal. The specific objectives include:
Analyzing trends in key governance indicatorsâsuch as rule of law, voice and accountability, political stability, government effectiveness, regulatory quality, and control of corruption and their correlation with Nepal's economic growth rate.
Investigating the overall causal relationship between good governance indicators and the GDP growth rate in Nepal.
Materials and Methods
This study employs aggregated data from the World Bank, concentrating on governance indicators such as political stability, absence of violence/terrorism, control of corruption, and voice and accountability, all obtained from the World Bank Governance Indicators database. GDP growth data was sourced from the Ministry of Finance, while additional governance indicators were acquired from the World Development Indicators database. Most of the data were collected from various editions of the Economic Survey published by the Ministry of Finance and the Economic Bulletin of the Nepal Rastra Bank (NRB). Additionally, migration data was sourced from the Department of Immigration of Nepal. The study examines the relationship between governance indicators and GDP growth in Nepal from 2000 to 2020, utilizing data from multiple sources and incorporating all datasets used throughout the research, employing trend analysis and the Granger causality test.
Descriptive and statistical analysis methods were applied to derive the results. Trend analysis and other relevant statistical tools were utilized to analyze the data. The Granger causality test was employed to identify the causal relationships between the dependent and independent variables. This test, developed by Granger (1969), is used to determine whether one time series can predict another. I used the following equation:
Yt may Granger âcause zt without violating the weak exogeneity of zt. However, suppose there exists the factorization.
Dz(z1t, z2t/Xt-1=Dz1/z2(z1t,Xt-1) Dz2(z2t/wt-1,zt-1)
The equation posits two hypotheses
H1:nj=0H_1: n_j = 0H1 :nj=0 for j=1,â¦,pj = 1, \ldots, pj=1,â¦,p, suggesting that the independent variable does not Granger-cause GDP.
H1:j=0H_1: j = 0H1: j=0 for j=1,â¦,pj = 1, \ldots, pj=1,â¦,p, which indicates that GDP does not Granger-cause the independent variables.
If the null hypothesis is rejected, it leads to the acceptance of the alternative hypothesis. This subject is examined in the International Journal of Pure and Applied Mathematics. Furthermore, qualitative methods were applied to analyze and interpret the findings.
If the null hypothesis is rejected, it leads to the acceptance of the alternative hypothesis. This subject is examined in the International Journal of Pure and Applied Mathematics. Furthermore, qualitative methods were applied to analyze and interpret the findings.
Results
The Trend analysis
The Worldwide Governance Indicators (WGI), which include six dimensions besides GDP growth, are used to assess the trends of good governance in Nepal from 2000 to 2020. The following figure shows seven trend lines representing the different dimensions of Nepal's GDP and WGI.
The relationship between GDP and political stability and violence (PSV) shows that political stability was poor between 2000 and 2012, mainly because of the Maoist civil war. During this period, the GDP growth rate also remained low, with both trends being subject to fluctuations. However, from 2012 to 2014, the PSV trend improved and was accompanied by a positive increase in GDP growth. This stabilization can be attributed to the main political party regaining a dominant position, which helped to mitigate civil unrest.
In 2015, Nepal was hit by devastating earthquakes, which led to significant loss of life and economic damage. In addition, the drafting of a new constitution by a participatory assembly was delayed, contributing to government instability and further hampering economic growth. After the adoption of the new constitution, the government stabilized, which led to an increase in GDP growth. Unfortunately, the outbreak of the COVID-19 pandemic in 2019 hurt the economy, resulting in a GDP growth rate of -2.07% for 2020/21 (Economic Survey, 2020/21).
The trend between GDP and government effectiveness (GEF), as shown in Figure 1, shows fluctuations throughout the study period from 2000 to 2020. In the early 2000s, the democratic government was perceived as strong, which boosted public confidence in its accountability. However, after 2001, the Maoist civil war intensified, and the king assumed absolute power, undermining public confidence in the government. As a result, the government's effectiveness declined until 2006, reflecting a period of low economic growth.
After the Maoists embraced the democratization process, government effectiveness improved, paralleling an increase in GDP growth with the formation of a new government under the new constitution. However, the 2015 earthquakes caused significant damage to the national economy. The trends in government effectiveness and GDP growth remained closely aligned until 2019. Thereafter, the COVID-19 pandemic disrupted government functions and hurt economic performance. The analysis suggests a positive relationship between these variables; a strong and effective government correlates with significant GDP growth. This underscores the need for robust, effective governance to promote better economic development.
The trends in regulatory quality (RQ) and the economic growth rate (GDP) also showed fluctuations throughout the period under review. The relationship between these two variables depends on the effectiveness of the government, as the figure shows. In the beginning, when the government was strong, the regulatory capacity was also robust. However, the quality of regulation increased slightly from 2004 to 2005, followed by a continuous decline until 2018, with little change observed until 2020. This trend mirrors the development of GDP over the same period, showing a positive interdependence between regulatory quality and economic growth.
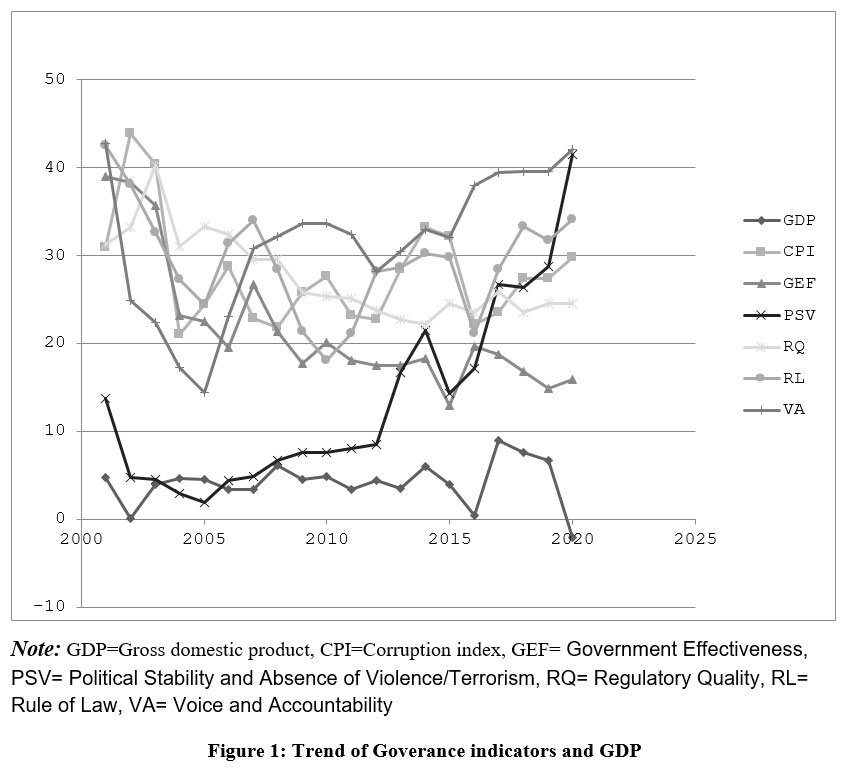 | Figure 1: Trend of Goverance indicators and GDP |
Note: GDP=Gross domestic product, CPI=Corruption index, GEF= Government Effectiveness, PSV= Political Stability and Absence of Violence/Terrorism, RQ= Regulatory Quality, RL= Rule of Law, VA= Voice and Accountability
The rule of law (RL) plays a crucial role in promoting economic growth in a country, as previous studies have shown. Its effectiveness is closely linked to the stability and effectiveness of the government. In 2000, the rule of law trend was relatively high, but showed instability and declined until 2005. By 2007, there was a brief rebound, followed by another decline that continued until 2010. From 2010 to 2014, the rule of law improved again but experienced a further decline in 2015. It then rose steadily until 2018, only to be subject to frequent fluctuations until 2020. The relationship between GDP and the rule of law appears to be positively correlated, suggesting that economic growth is more likely to thrive under improved rule of law conditions.
The development of Voice and Accountability (VA) to GDP is shown in Figure 1. In 2000, this indicator was robust but began to decline by 2005. This year marked a significant transition for Nepal as the country adopted a federal political system, which improved the capacity for public voice and accountability. Following this political transition, both voice and accountability indicators showed a steady upward trend until 2020, despite some fluctuations throughout the study period. Overall, the trend in voice and accountability has been upward since the political changes in Nepal.
Comparing this with GDP growth, the trends for both indicators appear to be closely aligned after 2019. The COVID-19 pandemic has led to stagnation in various sectors, but the dimensions of voice and accountability have remained strong despite a decline in GDP. This situation reflects a unique context for Nepal, although in general a positive relationship between voice and accountability and economic growth can be expected.
Analysis of Good Governance and Economic Growth
The hypothesis suggests that effective administration and governance play a crucial role in the efficient allocation and management of resources, which can enhance economic performance and growth. As a result, higher scores on the Worldwide Governance Indicators (WGI) are associated with increased economic growth and higher per capita income. Within this framework, the analysis uses these six dimensions as independent variables and GDP growth as the dependent variable, as outlined below:
Unit Root Test
In the initial stage of the analysis, the Augmented Dickey-Fuller (ADF) test is performed to evaluate the stationarity of the time series data. Confirming stationarity is crucial for achieving reliable results in time series analysis, as it enhances the accuracy of the models used. A time series is considered stationary if its mean and variance remain constant over time, with the covariance between two time points depending solely on the lag.
The ADF test investigates the integration order of each time series. Table 1 summarizes the ADF test results for each variable, presenting both their levels and first differences. The results show that some variables have p-values greater than 0.05, indicating that the null hypothesis cannot be rejected. Consequently, these variables are classified as non-stationary, implying they behave like a random walk with drift and do not exhibit a deterministic time trend. Additionally, the absolute values of the test statistics fall below the critical values at the 5% significance level, reinforcing the existence of a unit root. This indicates that the variables are non-stationary at their levels, necessitating data differentiation before further analysis.
The analysis indicates that, given the initial non-stationarity, the most effective approach is to calculate the first difference for all variables before conducting the co-integration test. Upon reviewing these first differences, it is found that all variables have p-values below 0.05. This suggests that the absolute values of the test statistics exceed the critical threshold at the 5% significance level, enabling us to reject the null hypothesis and affirming that the variables are stationary at their first difference.
Furthermore, unit root tests validate that all variables exhibit non-stationarity at their levels. The test statistics reveal that the level series are spurious, as shown by the results of the unit root tests. Notably, the analysis of the second difference indicates that none of the series contain unit roots, confirming that they are integrated of order one.
Table 1: ADF Unit Root Test Results
Level | ADF Statistics | LNGDP | LNCPI | LNGEF | LNPSV | LNRQ | LNRL | LNVA |
With constant | P- value | 0.0055 | 0.0013 | 0.1828 | 0.9278 | 0.573 | 0.0342 | 0.4495 |
T-value | 4.1888 | -4.8617 | -2.2965 | 1.2244 | -0.8455 | -3.2389 | -1.6283 | |
without constant | P- value | 0.0129 | 0.4111 | 0.0842 | 0.9414 | 0.4323 | 0.5221 | 0.9948 |
T-value | -2.6923 | -0.6715 | -1.6975 | 1.2733 | -0.6269 | -0.4096 | 2.5572 | |
Remarks | Sig. | No. Sig | No. Sig. | No. Sig | No. Sig | No. Sig | No Sig. | |
First different | ||||||||
With constant | P- value | 0.0033 | 0.0001 | 0.0167 | 0.0427 | 0 | 0.5299 | 0.0096 |
T-value | -4.495 | -6.3387 | -3.137 | -3.137 | -6.5802 | -1.4461 | -4.0259 | |
without constant | P- value | 0.0001 | 0 | 0.0001 | 0.0001 | 0 | 0.1123 | 0.0004 |
T-value | -4.7971 | -6.4588 | -4.6345 | -4.6345 | -6.4869 | -1.5402 | -4.113 | |
Remarks | Sig. | Sig. | Sig. | Sig. | Sig. | No Sig. | Sig. | |
Second different | ||||||||
With constant | P- value | 0.0129 | 0 | 0.0021 | 0.0005 | 0 | 6E-05 | 0.0056 |
T-value | -3.8214 | -9.8929 | -4.8096 | -5.4889 | -10.247 | -5.6663 | -4.226 | |
without constant | P- value | 0.0006 | 0 | 0.0001 | 0 | 0 | 0 | 0.0003 |
T-value | -3.961 | -9.9865 | -4.9649 | -5.4966 | -10.519 | -5.999 | -4.266 | |
Remarks | Sig. | Sig. | Sig. | Sig. | Sig. | Sig. | Sig. | |
As a result, the level forms of the data at the second difference are employed in the empirical analysis, particularly for constructing empirical models. In summary, while the variables show non-stationarity at both the level and first difference, they demonstrate stationarity at the second difference, which qualifies them for additional analyses.
Granger Causality Test
The Granger Causality test is a statistical approach used to evaluate whether one time series can effectively predict another. According to Granger this test examines if past values of a variable help forecast changes in another variable. Specifically, variable Y is Granger-caused by variable X if the historical values of X improve the prediction of Y's values. This study aims to explore the relationships between various macroeconomic variables and real GDP, investigating whether real GDP affects these macroeconomic variables or the other way around. The results of the Granger causality test are presented in Table 2.
The Granger causality test results show that out of 18 variable pairs analyzed, 12 exhibit significant causal relationships. Among these, six pairs reflect bidirectional causality, while the other six display unidirectional causality. Importantly, the findings indicate that control of corruption significantly impacts economic growth. The test for the null hypothesis that control of corruption (LNCC) does not Granger-cause GDP (LNGDP) led to its rejection (p = 0.0687), as this p-value is below 0.10. Consequently, the alternative hypothesis that control of corruption (CC) Granger causes GDP growth is supported.
On the other hand, the null hypothesis that GDP growth (LNGDP) does not Granger-cause control of corruption (LNCC) is accepted (p = 0.2565), as this p-value is above 0.10. Therefore, we conclude that control of corruption (CC) has a causal effect on GDP growth, indicating that greater control of corruption is linked to higher GDP. This relationship is unidirectional; increased corruption levels are associated with reduced GDP growth in Nepal, aligning with findings from earlier studies. For instance, Mo (2001) explored the relationship between corruption and economic growth in Hong Kong and found that a 1% rise in corruption results in a 0.72% decline in the growth rate, which mirrors the situation in Nepal.
The causality tests examining the null hypothesis that GDP growth (LNGDP) does not Granger-cause government effectiveness (LNGEF) resulted in a rejection of this hypothesis (p = 0.0177), as this p-value is less than 0.10. This finding supports the alternative hypothesis, indicating that LNGDP does Granger-cause LNGEF. Conversely, the hypothesis that LNGEF does not Granger-cause LNGDP is accepted (p = 0.1557), suggesting that while GDP growth affects government effectiveness, the opposite is not true.
Additionally, the tests regarding regulatory quality (LNRQ) indicate that the null hypothesis stating LNRQ does not Granger-cause GDP growth is rejected (p = 0.0311), confirming that LNGDP Granger-causes LNRQ. Furthermore, the null hypothesis that LNGDP does not Granger-cause LNRQ is also rejected (p = 0.0018). This leads us to conclude that there exists a bidirectional causality between GDP growth and regulatory quality, suggesting a relationship where increases in GDP growth are correlated with improvements in regulatory quality and vice versa.
The causality tests for the null hypothesis that corruption control (LNCC) does not Granger-cause political stability (LNPSV) led to the rejection of the null hypothesis (p = 0.0283), as this p-value is below 0.10. This finding supports the alternative hypothesis, which posits that corruption control (LNCC) contributes to political stability (LNPSV). In contrast, the hypothesis that LNPSV does not Granger-cause LNCC is accepted (p = 0.1619), since this p-value exceeds 0.10. Therefore, we conclude that while corruption control positively affects political stability, the relationship is unidirectional; political stability does not significantly impact corruption control in Nepal's public sector. This aligns with previous studies, such as Mo (2001), which indicated that political instability accounts for approximately 53% of the total impact of corruption on economic growth, underscoring its significance for economic development and its relevance to the current situation in Nepal.
Table 2: Null Hypothesis
Null Hypothesis: | Obs | F-Statistic | Prob. |
LNCC does not Granger Cause LNGDP | 18 | 3.31418 | 0.0687** |
LNGDP does not Granger Cause LNCC | 1.51336 | 0.2565 | |
LNGEF does not Granger Cause LNGDP | 18 | 2.15307 | 0.1557 |
LNGDP does not Granger Cause LNGEF | 5.58918 | 0.0177* | |
LNRL does not Granger Cause LNGDP | 18 | 0.74403 | 0.4944 |
LNGDP does not Granger Cause LNRL | 1.18758 | 0.336 | |
LNRQ does not Granger Cause LNGDP | 18 | 4.58852 | 0.0311** |
LNGDP does not Granger Cause LNRQ | 10.7199 | 0.0018* | |
LNVA does not Granger Cause LNGDP | 18 | 0.36404 | 0.7017 |
LNGDP does not Granger Cause LNVA | 2.09987 | 0.1621 | |
LNPSV does not Granger Cause LNCC | 18 | 2.10174 | 0.1619 |
LNCC does not Granger Cause LNPSV | 4.75135 | 0.0283* | |
LNRL does not Granger Cause LNCC | 18 | 1.34778 | 0.2938 |
LNCC does not Granger Cause LNRL | 0.01182 | 0.9883 | |
LNRQ does not Granger Cause LNCC | 18 | 1.19209 | 0.3347 |
LNCC does not Granger Cause LNRQ | 2.02672 | 0.1713 | |
LNVA does not Granger Cause LNCC | 18 | 4.26645 | 0.0376* |
LNCC does not Granger Cause LNVA | 5.96681 | 0.0145* | |
LNPSV does not Granger Cause LNGEF | 18 | 0.84369 | 0.4524 |
LNGEF does not Granger Cause LNPSV | 7.01067 | 0.0086* | |
LNRL does not Granger Cause LNGEF | 18 | 0.02296 | 0.9773 |
LNGEF does not Granger Cause LNRL | 2.04443 | 0.169 | |
LNRQ does not Granger Cause LNGEF | 18 | 0.6031 | 0.5617 |
LNGEF does not Granger Cause LNRQ | 2.4789 | 0.1225 | |
LNVA does not Granger Cause LNGEF | 18 | 0.2749 | 0.764 |
LNGEF does not Granger Cause LNVA | 4.55179 | 0.0317* | |
LNRL does not Granger Cause LNPSV | 18 | 0.51749 | 0.6078 |
LNPSV does not Granger Cause LNRL | 0.03901 | 0.9619 | |
LNRQ does not Granger Cause LNPSV | 18 | 2.81694 | 0.0963** |
LNPSV does not Granger Cause LNRQ | 6.0323 | 0.014* | |
LNVA does not Granger Cause LNPSV | 18 | 0.1501 | 0.8621 |
LNPSV does not Granger Cause LNVA | 0.78287 | 0.4775 | |
LNRQ does not Granger Cause LNRL | 18 | 0.19787 | 0.8229 |
LNRL does not Granger Cause LNRQ | 1.72368 | 0.2168 | |
LNVA does not Granger Cause LNRL | 18 | 0.10945 | 0.8971 |
LNRL does not Granger Cause LNVA | 0.20195 | 0.8196 | |
LNVA does not Granger Cause LNRQ | 18 | 2.1832 | 0.1522 |
LNRQ does not Granger Cause LNVA | 3.3904 | 0.0653** |
Sample 20, Lag: 2
The causality tests for the null hypothesis that voice and accountability (LNVA) do not Granger-cause corruption control (LNCC) resulted in the rejection of the null hypothesis (p = 0.0376), confirming that voice and accountability are indeed Granger causes of corruption control. Similarly, the null hypothesis that LNCC does not Granger-cause LNVA was also rejected (p = 0.0145). Therefore, we conclude that there is bidirectional causality between voice and accountability and corruption control; an increase in voice and accountability correlates with a decrease in corruption.
In analyzing the connection between government effectiveness (LNGEF) and voice and accountability (LNVA), we rejected the null hypothesis that LNGEF does not Granger-cause LNVA (p = 0.0317). This suggests that government effectiveness has a positive effect on voice and accountability. Conversely, the hypothesis that LNVA does not Granger-cause LNGEF was accepted (p = 0.764), indicating that voice and accountability do not significantly influence government effectiveness in Nepal. This points to a unidirectional causal relationship where government effectiveness fosters voice and accountability.
The causality tests for regulatory quality (LNRQ) and political stability (LNPSV) led to the rejection of the null hypothesis that LNRQ does not Granger-cause LNPSV (p = 0.0963), concluding that regulatory quality affects political stability. Furthermore, we rejected the null hypothesis that LNPSV does not Granger-cause LNRQ (p = 0.014), revealing a bidirectional causality between the two variables. This indicates a positive relationship, where advancements in one are linked to improvements in the other.
Furthermore, the tests assessing the impact of regulatory quality (LNRQ) on voice and accountability (LNVA) led to the rejection of the null hypothesis (p = 0.0653), suggesting that regulatory quality positively influences voice and accountability. Conversely, we accepted the null hypothesis that LNVA does not Granger-cause LNRQ (p = 0.1522), indicating that voice and accountability do not significantly affect regulatory quality. Thus, there is a unidirectional causal relationship between voice and accountability and regulatory quality in Nepal.
Discussions
This study explores the intricate relationship between governance indicators and GDP growth in Nepal from 2000 to 2020, emphasizing the significance of good governance for economic development. The trend analysis reveals that essential governance indicatorsâsuch as voice and accountability, political stability, government effectiveness, regulatory quality, rule of law, and control of corruption is influenced by significant national events, including political turmoil, natural disasters, and global pandemics. These findings underline the susceptibility of economic growth to the quality of governance and external shocks.
The results of the Augmented Dickey-Fuller (ADF) test further enhance the reliability of our analysis, confirming that while the variables initially show non-stationarity, they achieve stationarity in the second difference. This allows for a more thorough examination of the relationships over time. Importantly, the Granger causality tests reveal that effective control of corruption positively affects GDP growth, supporting the notion that anti-corruption efforts can drive economic development. This underscores the vital role of transparency and effective governance in creating an environment that fosters economic activities.
Conversely, the analysis shows that GDP growth has no significant impact on the fight against corruption, indicating a one-sided relationship in which economic growth alone cannot eliminate the causes of corruption. The moderate GDP growth rates observed during the study period emphasize the need for sustained and targeted policy interventions to effectively fight corruption.
Furthermore, the results show that the quality of regulation plays a dual role, both influencing and responding to GDP growth. This bidirectional relationship highlights the need for a robust regulatory framework to promote economic prosperity. A thriving economy can facilitate the implementation and enforcement of better regulations, creating a virtuous cycle of governance and development.
Crucially, controlling corruption contributes to political stability, a vital ingredient for nurturing an environment that supports economic growth. Enhanced governance through stronger mechanisms of voice and accountability can further mitigate corruption, aligning with the Socratic philosophy that greater public oversight leads to increased accountability and reduced corruption.
Conclusion
This analysis underscores that good governance is not merely a supplementary factor but a crucial driver of economic development in Nepal. By prioritizing comprehensive strategies that combat corruption and enhance regulatory quality, Nepal can effectively pursue sustainable development. The interconnectedness of governance, regulation, and economic growth highlights the necessity for coordinated efforts to establish a resilient economy that benefits all citizens.
Based on the research findings, several key recommendations have been identified to foster sustainable economic growth in Nepal. First, it is imperative to strengthen anti-corruption measures. The government should prioritize transparency and enforce stringent anti-corruption laws to enhance accountability within public institutions. Second, improving regulatory quality by streamlining regulations will contribute to a more favorable investment climate. Third, ensuring political stability through inclusive governance and dialogue among political factions is essential for addressing the root causes of unrest, as highlighted by Smith and Doe (2022).
Moreover, promoting public participation is vital for democratic governance, allowing citizens to engage in decision-making processes and reinforcing accountability. This can be facilitated by targeted training programs for civil servants, as noted by Johnson (2021).
Ultimately, these findings are of significant value to policymakers, international organizations, and researchers focused on advancing good governance and economic development in Nepal. Overall, the recommendations emphasize the importance of strengthening governance frameworks to promote economic development and illustrate the interdependence between governance, regulation, and sustainable growth.
Acknowledgment
The author wishes to express deep gratitude to Nepal Sanskrit University for providing the opportunity to undertake doctoral research. Special thanks extended to the Department of Economics at Nepal Sanskrit University for their consistent support throughout this academic journey.
Funding Sources
The author received no financial support for the research, authorship, and/or publication of this article.
Conflict of Interest
The author do not have any conflict of interest.
Data Availability Statement
This statement does not apply to this article.
Ethics Statement
This research did not involve human participants, animal subjects, or any material that requires ethical approval.
Informed Consent Statement
This study did not involve human participants, and therefore, informed consent was not required.
Author Contributions
The sole author was responsible for the conceptualization, methodology, data collection, analysis, writing, and final approval of the manuscript.
References
- Fukuyama, F. (2013). What is governance? Working Paper 314. Center for Global Development.
- Johnston, M. (2002). What is good governance? United Nations Office on Drugs and Crime. https://www.unodc.org/e4j/en/anti-corruption/module-2/key-issues/what-is-good-governance.html
- Johnson, A. (2021). Capacity building for effective governance. Governance Press.
- Kaufmann, D., & Kraay, A. (2002). Growth without governance. Policy Research Working Paper No. 2928. World Bank.
CrossRef - Magar, U. B. R., & Upadhyaya, N. R. (2021). Remittances and economic growth: A causality analysis for Nepal. International Journal of Economics and Finance, 3(1), 1-15. https://doi.org/10.54105/ijef.B2523.112222
CrossRef - Millennium Development Goals (MDGs). (2007). World Bank Group.
- Economic survey 2020/2021 Ministry of Finance of Nepal. (2021).
- Mo, P. H. (2001). Corruption and economic growth. Journal of Comparative Economics, 29, 66-70. https://doi.org/10.1006/jcec.2000.1703
CrossRef - Paitoon, K. (2018). Good governance and economic growth: An investigation of Thailand and selected countries. Eurasian Journal of Economics and Finance, 6(10), 93-106. https://doi.org/10.15604/EJEF.2018
CrossRef - Smith, J., & Doe, R. (2022). Political stability and governance in Nepal. Asian Journal of Political Science, 18(3), 200-215.
- Transparency International. (2020). Global corruption report.
- United Nations. (2017). The sustainable development goals report.
- World Bank. (2017). World development report: Governance and the law. Washington, D.C.
- World Bank Group. (2017). The Worldwide Governance Indicators (WGI). https://www.worldbank.org/en/research [Accessed on 10 January 2018].

This work is licensed under a Creative Commons Attribution 4.0 International License.


